Platfora (http://www.platfora.com/)
Provide a big data analytics solution that transforms raw data in Hadoop into interactive, in-memory business intelligence.
Alpine Data Labs (http://alpinenow.com/)
Provide a Hadoop-based data analysis platform.
Altiscale (http://www.altiscale.com/)
Provide Hadoop-as-a-Service (HaaS).
Trifacta (http://www.trifacta.com/)
Provide a platform that enables users to transform raw, complex data into clean and structured formats for analysis.
Splice Machine (http://www.splicemachine.com/)
Provide a Hadoop-based, SQL-compliant database designed for big data applications.
DataTorrent (http://www.datatorrent.com/)
Provide a real-time stream processing platform built on Hadoop.
Qubole (http://www.qubole.com/)
Offer Big Data-as-a-Service with a "true auto-scaling Hadoop cluster."
Continuuity (http://www.continuuity.com/)
Provide a Hadoop-based big data application hosting platform.
Xplenty (http://www.xplenty.com/)
Provide HaaS.
Nuevora (http://www.nuevora.com/)
Provide Big Data analytics applications.
source: http://www.cio.com/article/751572/10_Hot_Hadoop_Startups_to_Watch_
Wednesday, May 21, 2014

Data Scientist Salary Survey
Full O'Reilly Data Scientist Salary Survey: http://www.oreilly.com/data/free/files/stratasurvey.pdf
Key topics:

Key topics:
- By a significant margin, more respondents used SQL than any other tool (71% of respondents, compared to 43% for the next highest ranked tool, R).
- The open source tools R and Python, used by 43% and 40% of respondents, respectively, proved more widely used than Excel (used by 36% of respondents).
- Salaries positively correlated with the number of tools used by respondents. The average respondent selected 10 tools and had a median income of $100k; those using 15 or more tools had a median salary of $130k.
- Two clusters of correlating tool use: one consisting of open source tools (R, Python, Hadoop frameworks, and several scalable machine learning tools), the other consisting of commercial tools such as Excel, MSSQL, Tableau, Oracle RDB, and BusinessObjects.
- Respondents who use more tools from the commercial cluster tend to use them in isolation, without many other tools.
- Respondents selecting tools from the open source cluster had higher salaries than respondents selecting commercial tools. For example, respondents who selected 6 of the 19 open source tools had a median salary of $130k, while those using 5 of the 13 commercial cluster tools earned a median salary of $90k.
Data Science Venn Diagram
The most famous diagram describing skills involved in Data Science:

created by Drew Conway.
full diagram description:
Book - Data Scientists types and skills
This book describes Data Scientists types and most common skillsets, tells you why a complete Data Scientist probably doesn't exist.
MUST READ if you are creating a Data Science team.
The data scientists are classified as follows:
Book Description:
"Despite the excitement around "data science," "big data," and "analytics," the ambiguity of these terms has led to poor communication between data scientists and organizations seeking their help. In this report, authors Harlan Harris, Sean Murphy, and Marck Vaisman examine their survey of several hundred data science practitioners in mid-2012, when they asked respondents how they viewed their skills, careers, and experiences with prospective employers. The results are striking.
Based on the survey data, the authors found that data scientists today can be clustered into four subgroups, each with a different mix of skillsets. Their purpose is to identify a new, more precise vocabulary for data science roles, teams, and career paths.
This report describes:
Four data scientist clusters: Data Businesspeople, Data Creatives, Data Developers, and Data Researchers
Cases in miscommunication between data scientists and organizations looking to hire
Why "T-shaped" data scientists have an advantage in breadth and depth of skills
How organizations can apply the survey results to identify, train, integrate, team up, and promote data scientists"
click to download:

sources:
http://cdn.oreillystatic.com/oreilly/radarreport/0636920029014/Analyzing_the_Analyzers.pdf
http://www.edureka.in/blog/types-of-data-scientists/?imm_mid=0bd168&cmp=em-strata-na-na-newsltr_20140528_elist
MUST READ if you are creating a Data Science team.
The data scientists are classified as follows:
- Data Researcher
The professionals in this category come from the academic world and have in-depth backgrounds in statistics or the physical or social sciences. This type of data scientist often holds a PhD but is weakly skilled in Machine learning, Programming or Business.
- Data Developer
These guys tend to concentrate on technical issues that come with handling data. They are strong in programming and machine learning but weak in business and statistics skills.
- Data Creatives
These are the guys who make something innovative out of mountains of data. They are strongly skilled in machine learning, Big Data, programming and other skills to handle massive data.
- Data Business people
They represent the business side and are responsible for making vital business decisions through data analytics techniques. They are an eclectic blend of business and technical proficiency.
Book Description:
"Despite the excitement around "data science," "big data," and "analytics," the ambiguity of these terms has led to poor communication between data scientists and organizations seeking their help. In this report, authors Harlan Harris, Sean Murphy, and Marck Vaisman examine their survey of several hundred data science practitioners in mid-2012, when they asked respondents how they viewed their skills, careers, and experiences with prospective employers. The results are striking.
Based on the survey data, the authors found that data scientists today can be clustered into four subgroups, each with a different mix of skillsets. Their purpose is to identify a new, more precise vocabulary for data science roles, teams, and career paths.
This report describes:
Four data scientist clusters: Data Businesspeople, Data Creatives, Data Developers, and Data Researchers
Cases in miscommunication between data scientists and organizations looking to hire
Why "T-shaped" data scientists have an advantage in breadth and depth of skills
How organizations can apply the survey results to identify, train, integrate, team up, and promote data scientists"
click to download:
sources:
http://cdn.oreillystatic.com/oreilly/radarreport/0636920029014/Analyzing_the_Analyzers.pdf
http://www.edureka.in/blog/types-of-data-scientists/?imm_mid=0bd168&cmp=em-strata-na-na-newsltr_20140528_elist
Social Data Revolution - Andreas Weigend (former Amazon Chief Data Scientist)
Andreas Weigend is former Amazon Chief Data Scientist and now he teaches at Berkeley and Stanford.
He created course, articles and youtube channel about what he call as "Social Data Revolution".
I watched some videos (below) and this presentation (http://weigend.com/files/speaking/Weigend_IAB-WOBI_MIL_2013.12.04.pdf), and here are key points I marked from his thoughts:
Data Rules:
Rule #1: Start with a question, not with the data
Rule #2: Base the equation of your business on metrics that matter to your customers
Rule #3: Focus on decisions andactions, and design for feedback
Rule #4: Embrace transparency: Make it trivially easy for people to connect, contribute, and collaborate
Create data to solve your problem, mindset is the most important part:

5 stages of Amazon Recommendations:
Social Data Revolution
Billions of people socialize "their" data with friends, companies, and the world. This irreversible cultural shift, the Social Data Revolution, has transformed how we view our friends and ourselves (as well as our shoes). Social data influence our purchasing and lifestyle decisions. Companies and governments now observe our decisions and how we got there. So, your shoe selfie is also a clue for today's data detectives as they piece together your digital footprint.
About Andreas Weigend
Dr. Weigend was the Chief Scientist at Amazon, where he focused on data strategy and customer centricity. He is an advisor to startups around the world, and a consultant to established companies including Alibaba, Lufthansa, and MasterCard. He teaches at Berkeley and Stanford, and directs the Social Data Lab. He is also a limited partner at Founder's Fund.
sources:
http://www.weigend.com/sdr/
http://weigend.com/files/speaking/Weigend_IAB-WOBI_MIL_2013.12.04.pdf
http://www.youtube.com/watch?v=3INyk-Up_LY&list=UUkdjJNKqfG0idaTaahWiUCw
http://blogs.hbr.org/2009/05/the-social-data-revolution/
He created course, articles and youtube channel about what he call as "Social Data Revolution".
I watched some videos (below) and this presentation (http://weigend.com/files/speaking/Weigend_IAB-WOBI_MIL_2013.12.04.pdf), and here are key points I marked from his thoughts:
Data Rules:
Rule #1: Start with a question, not with the data
Rule #2: Base the equation of your business on metrics that matter to your customers
Rule #3: Focus on decisions andactions, and design for feedback
Rule #4: Embrace transparency: Make it trivially easy for people to connect, contribute, and collaborate
Create data to solve your problem, mindset is the most important part:
5 stages of Amazon Recommendations:
- Manual (Experts)
- Implicit (Clicks, Searches)
- Explicit (Reviews, Lists)
- Situation (Local, Mobile)
- Connections (Social graph)
Social Data Revolution
Billions of people socialize "their" data with friends, companies, and the world. This irreversible cultural shift, the Social Data Revolution, has transformed how we view our friends and ourselves (as well as our shoes). Social data influence our purchasing and lifestyle decisions. Companies and governments now observe our decisions and how we got there. So, your shoe selfie is also a clue for today's data detectives as they piece together your digital footprint.
About Andreas Weigend
Dr. Weigend was the Chief Scientist at Amazon, where he focused on data strategy and customer centricity. He is an advisor to startups around the world, and a consultant to established companies including Alibaba, Lufthansa, and MasterCard. He teaches at Berkeley and Stanford, and directs the Social Data Lab. He is also a limited partner at Founder's Fund.
sources:
http://www.weigend.com/sdr/
http://weigend.com/files/speaking/Weigend_IAB-WOBI_MIL_2013.12.04.pdf
http://www.youtube.com/watch?v=3INyk-Up_LY&list=UUkdjJNKqfG0idaTaahWiUCw
http://blogs.hbr.org/2009/05/the-social-data-revolution/
Analytics Maturity Capabilities
Gartner Analytic Ascendancy Model (I also understand as Analytics Maturity Capabilities):
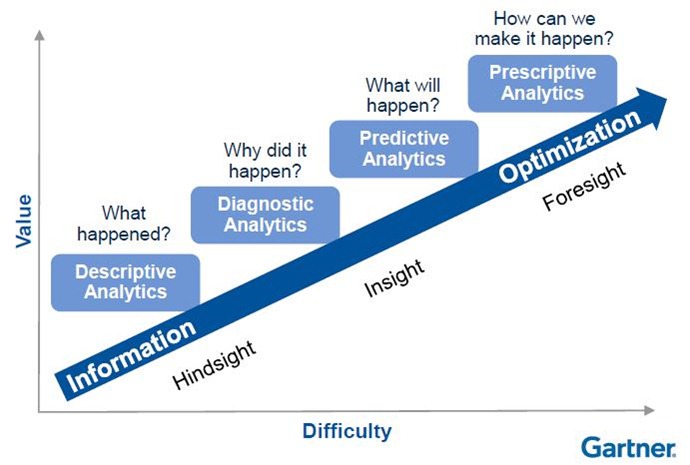
sources:
http://timoelliott.com/blog/2013/02/gartnerbi-emea-2013-part-1-analytics-moves-to-the-core.htmlhttp://meetings2.informs.org/analytics2013/Advancing%20Analytics_LKart_INFORMS%20Exec%20Forum_April%202013_final.pdf
http://www.rosebt.com/blog/descriptive-diagnostic-predictive-prescriptive-analytics
Design Thinking + Data Science
Nice story using Design Thinking on Big Data projects.
follow link below:
http://strata.oreilly.com/2013/10/design-thinking-and-data-science.html
follow link below:
http://strata.oreilly.com/2013/10/design-thinking-and-data-science.html
Methodology - CRISP-DM
CRISP-DM (Cross Industry Standard Process for Data Mining) [1] is a data mining process model that describes commonly used approaches that data mining experts use to tackle problems. Polls conducted in 2002, 2004, and 2007 show that it is the leading methodology used by data miners.

Business Understanding
This initial phase focuses on understanding the project objectives and requirements from a business perspective, and then converting this knowledge into a data mining problem definition, and a preliminary plan designed to achieve the objectives.
Data Understanding
The data understanding phase starts with an initial data collection and proceeds with activities in order to get familiar with the data, to identify data quality problems, to discover first insights into the data, or to detect interesting subsets to form hypotheses for hidden information.
Data Preparation
The data preparation phase covers all activities to construct the final dataset (data that will be fed into the modeling tool(s)) from the initial raw data. Data preparation tasks are likely to be performed multiple times, and not in any prescribed order. Tasks include table, record, and attribute selection as well as transformation and cleaning of data for modeling tools.
Modeling
In this phase, various modeling techniques are selected and applied, and their parameters are calibrated to optimal values. Typically, there are several techniques for the same data mining problem type. Some techniques have specific requirements on the form of data. Therefore, stepping back to the data preparation phase is often needed.
Evaluation
At this stage in the project you have built a model (or models) that appear to have high quality, from a data analysis perspective. Before proceeding to final deployment of the model, it is important to more thoroughly evaluate the model, and review the steps executed to construct the model, to be certain it properly achieves the business objectives. A key objective is to determine if there is some important business issue that has not been sufficiently considered. At the end of this phase, a decision on the use of the data mining results should be reached.
Deployment
Creation of the model is generally not the end of the project. Even if the purpose of the model is to increase knowledge of the data, the knowledge gained will need to be organized and presented in a way that the customer can use it. Depending on the requirements, the deployment phase can be as simple as generating a report or as complex as implementing a repeatable data mining process. In many cases it will be the customer, not the data analyst, who will carry out the deployment steps. Even if the analyst deploys the model it is important for the customer to understand up front the actions which will need to be carried out in order to actually make use of the created models.
source:
http://en.wikipedia.org/wiki/Cross_Industry_Standard_Process_for_Data_Mining

Business Understanding
This initial phase focuses on understanding the project objectives and requirements from a business perspective, and then converting this knowledge into a data mining problem definition, and a preliminary plan designed to achieve the objectives.
Data Understanding
The data understanding phase starts with an initial data collection and proceeds with activities in order to get familiar with the data, to identify data quality problems, to discover first insights into the data, or to detect interesting subsets to form hypotheses for hidden information.
Data Preparation
The data preparation phase covers all activities to construct the final dataset (data that will be fed into the modeling tool(s)) from the initial raw data. Data preparation tasks are likely to be performed multiple times, and not in any prescribed order. Tasks include table, record, and attribute selection as well as transformation and cleaning of data for modeling tools.
Modeling
In this phase, various modeling techniques are selected and applied, and their parameters are calibrated to optimal values. Typically, there are several techniques for the same data mining problem type. Some techniques have specific requirements on the form of data. Therefore, stepping back to the data preparation phase is often needed.
Evaluation
At this stage in the project you have built a model (or models) that appear to have high quality, from a data analysis perspective. Before proceeding to final deployment of the model, it is important to more thoroughly evaluate the model, and review the steps executed to construct the model, to be certain it properly achieves the business objectives. A key objective is to determine if there is some important business issue that has not been sufficiently considered. At the end of this phase, a decision on the use of the data mining results should be reached.
Deployment
Creation of the model is generally not the end of the project. Even if the purpose of the model is to increase knowledge of the data, the knowledge gained will need to be organized and presented in a way that the customer can use it. Depending on the requirements, the deployment phase can be as simple as generating a report or as complex as implementing a repeatable data mining process. In many cases it will be the customer, not the data analyst, who will carry out the deployment steps. Even if the analyst deploys the model it is important for the customer to understand up front the actions which will need to be carried out in order to actually make use of the created models.
source:
http://en.wikipedia.org/wiki/Cross_Industry_Standard_Process_for_Data_Mining
The Data Scientific Method
Data Scientific Method
source: http://datascience101.wordpress.com/2012/06/27/the-data-scientific-method/#comments
- Start with a Question
- Leverage your current data
- Create features and run tests
- Analyze the results and draw insights
- Let the data frame a conversation
source: http://datascience101.wordpress.com/2012/06/27/the-data-scientific-method/#comments
googleVis on R (CRAN)
source: http://lamages.blogspot.com/2014/04/googlevis-051-released-on-cran.html
original mages' blog post:
googleVis 0.5.1 released on CRAN

New Features
original mages' blog post:
googleVis 0.5.1 released on CRAN

New Features
- New functions gvisSankey, gvisAnnotationChart, gvisHistogram, gvisCalendar and gvisTimeline to support the new Google charts of the same names (without 'gvis').
- New demo Trendlines showing how trend-lines can be added to Scatter-, Bar-, Column-, and Line Charts.
- New demo Roles showing how different column roles can be used in core charts to highlight data.
- New vignettes written in R Markdown showcasing googleVis examples and how the package works with knitr.
Changes
- The help files of gvis charts no longer show all their options, instead a link to the online Google API documentation is given.
- Updated googleVis demo
- All googleVis output will be displayed in your default browser. In previous versions of googleVis output could also be viewed in the preview pane of RStudio. This feature is no longer available with the current version of RStudio, but is likely to be introduced again with the release of RStudio version 0.99 or higher.
Twitter - DataViz - Sunrise
Data Visualization of tweets mentioning sunrise around the world:
source: http://cartodb.s3.amazonaws.com/static_vizz/sunrise.html
source: http://cartodb.s3.amazonaws.com/static_vizz/sunrise.html
Tuesday, May 20, 2014
Yahoo Betting on Hive + Tez + YARN
Key points from Yahoo post below, betting on Apache Hive, Tez and YARN:
- Pig was developed by Yahoo in 2007
- Yahoo adopted Hive in 2010 with limited usage
- Growth in percentage of hive jobs relative to overall hadoop jobs
- Benchmark on 300 nodes (I would be happy if I had 5 nodes for my tests)
- Most of the queries failed on Shark with a 10TB dataset
- In-Memory aproach fails when: a) data is too large to fit in memory; or b) memory resources have to be shared among tenants or users
original yahoo post:
Yahoo Betting on Apache Hive, Tez, and YARN
by The Hadoop Platforms Team
Low-latency SQL queries, Business Intelligence (BI), and Data Discovery on Big Data are some of the hottest topics these days in the industry with a range of solutions coming to life lately to address them as either proprietary or open-source implementations on top of Hadoop. Some of the popular ones talked about in the Big Data communities are Hive, Presto, Impala, Shark, andDrill.
Hive’s Adoption at Yahoo
Yahoo has traditionally used Apache Pig, a technology developed at Yahoo in 2007, as the de facto platform for processing Big Data, accounting for well over half of all Hadoop jobs till date. One of the primary reasons for Pig’s success at Yahoo has been its ability to express complex processing needs well through feature rich constructs and operators ideal for large-scale ETL pipelines. Something that is not easy to express in SQL. Researchers and engineers working on data systems built on Hadoop at the time found it an order of magnitude better than working with Java MapReduce APIs directly. Apache Pig settled in and quickly made a place for itself among developers.
Over time and with increased adoption of the Hadoop platform across Yahoo, a SQL or SQL-like solution over Hadoop started to become necessary for adhoc analytics that Pig was not well suited for. SQL is the most widely used language for data analysis and manipulation, and Hadoop had also started to reach beyond the data scientists and engineers to downstream analysts and reporting teams. Apache Hive, originally developed at Facebook in 2007-2008, was a popular and scalable SQL-like solution available over Hadoop at the time that ran in batch mode on Hadoop’s MapReduce engine. While Yahoo adopted Hive in 2010, its use remained limited.
On the other hand, MapReduce, Pig and Hive, all running on top of Hadoop, raised concerns around sharing of data among applications written using these different approaches. Pig and MapReduce’s tight coupling with underlying data storage was also an issue in terms of managing schema and format changes. Apache HCatalog, a table and storage management layer was conceived at Yahoo as a result in 2010 to provide a shared schema and data model for MapReduce, Pig, and Hive by providing wrappers around Hive’s metastore. HCatalog eventually merged with the Hive project in 2013, but remained central to our effort to register all data on the platform in a common metastore, and make them discoverable and sharable with controlled access.
The Need for Interactive SQL on Hadoop
By mid 2012, the need to make SQL over Hadoop more interactive became material as specific use cases and requirements emerged. At the same time, Yahoo had also undertaken a large effort to stabilize Hadoop 0.23 (pre Hadoop 2.x branch) and YARN to roll it out at scale on all our production clusters. YARNs value propositions were absolutely clear. To address the interactive SQL use cases, we started exploring our options in parallel, and around the same time, Project Stinger got announced as a community driven project from Hortonworks to make Hive capable of handling a broad spectrum of SQL queries (from interactive to batch) along with extending its analytics functions and standard SQL support. Early version of HiveServer2 also became available to address the concurrency and security issues in connecting Hive over standard ODBC and JDBC that BI and reporting tools like MicroStrategy and Tableau needed. We decided to stick with Hive and participate in its development and phased (Phases I, II, III) delivery. At this point, Hive also happens to be one of the fastest growing products in our platform technology stack (Fig 1) confirming the fact that SQL on Hadoop is a hot topic for good reasons.
 Fig 1. Growth in Hive jobs relative to overall Hadoop jobs
Why Hive?
So, why did we stick with Hive or as one may say, bet on Hive? We did an evaluation of available solutions, and stayed the course we were on with Hive as the best solution for our users for several key reasons:
- Hive is the SQL standard for Hadoop that has been around for seven years, battle tested at scale, and widely used across industries
- A single solution that works across a broad spectrum of data volumes (more on this in the performance section)
- HCatalog, part of Hive, acts as the central metastore for facilitating interoperability among various Hadoop tools
- A vibrant community from many well known companies with top notch engineers and architects vested in its future
- Top Level Project (TLP) with Apache Software Foundation (ASF) that offers several advantages, including our deep familiarity with ASF and all the related Hadoop ecosystem projects under Apache and the clarity around making contributions to gain influence in the community that may allow Yahoo to evolve Hive in a direction that meets our users needs
- Perhaps one of the few SQL on Hadoop solutions around that has been widely certified by BI vendors (an important distinction to consider as Hive gets used in many cases by data analysts and reporting teams directly)
- Alleviating performance concerns with relentless phased delivery (Hive 0.11, 0.12 and 0.13) against the initially stated performance goals
Query Performance on Hive 0.13
Since performance was one of users biggest concerns with Hive 0.10, the version Yahoo was running, we conducted Hive’s performance benchmarks, not to say that the significant facelift in features with later versions of Hive wasn’t important.
In one of the recent performance benchmarks Yahoo’s Hive team conducted on the Jan version of Hive 0.13, we found the query execution times dramatically better than Hive 0.10 on a 300 node cluster. To give you an idea of the magnitude of performance difference we observed, Fig 2 shows TCP-H benchmark results with 100 GB dataset on Hive 0.10 with RCFile (Row Columnar) format on Hadoop 0.23 (MapReduce on YARN) vs. Hive 0.13 with ORC File (Optimized Row Columnar), Apache Tez on YARN, Vectorization, and Hadoop 2.3). Security was turned off in both cases. With Hive 0.13, 18 out of 21 queries finished under 60 seconds with the longest still under 80 seconds. Also, Hive 0.13 execution times were comparable or better than Shark on a 100 node cluster.
 Fig 2. Hive 0.10 vs. Hive 0.13 on 100 GB of data
On the other hand, Hive 0.13 query execution times were not only significantly better at higher volumes of data (Fig 3 and 4) but also executed successfully without failing. In our comparisons and observations with Shark, we saw most queries fail with the larger (10TB) dataset. These same queries ran successfully and much faster on Hive 0.13, allowing for better scale. This was extremely critical for us, as we needed a single query and BI solution on the Hadoop grid regardless of dataset size. The Hive solution resonates with our users, as they do not have to worry about learning multiple technologies and discerning which solution to use when. A common solution also results in cost and operational efficiencies from having to build, deploy, and maintain a single solution.
 Fig 3. Hive 0.10 vs. Hive 0.13 on 1 TB of data
 Fig 4. Hive 0.10 vs. Hive 0.13 on 10 TB of data
The performance of Hive 0.13 is certainly impressive over its predecessors, but one must realize how these performance improvements came by. Several systems rely on caching data in memory to lower latency. While this works well for some use cases, the approach fails when either the data is too large to fit in the memory or on a shared multi-tenant environment where memory resources have to be shared among tenants or users. Hive 0.13, on the other hand, achieves comparable performance through ORC, Tez, and Vectorization (vectorized query processing) that does not suffer from the issues noted above. On the flip side, building solutions in this manner certainly requires heavy engineering investment (100s of man month in case of Hive 0.13 since the start of 2013) for robustness and flexibility.
Looking Ahead
We are excited about the work going on in the Hive community to take Hive 0.13 to the next level in subsequent releases in terms of both features and performance, in particular the Cost-based Query Optimizations and the ability to perform inserts, updates, and deletes with full ACID support.
Subscribe to:
Posts (Atom)